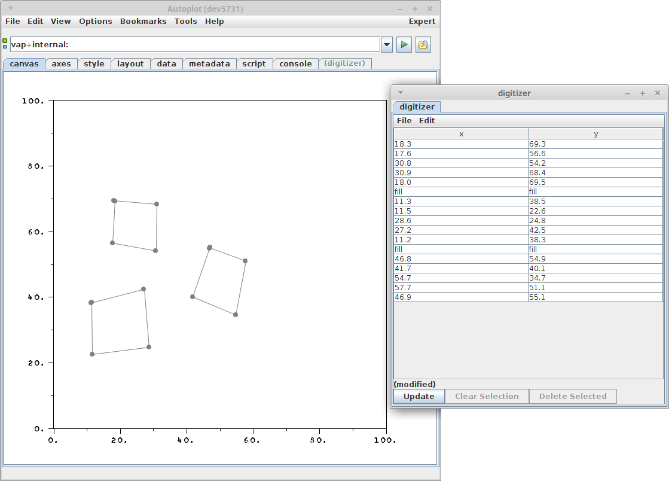
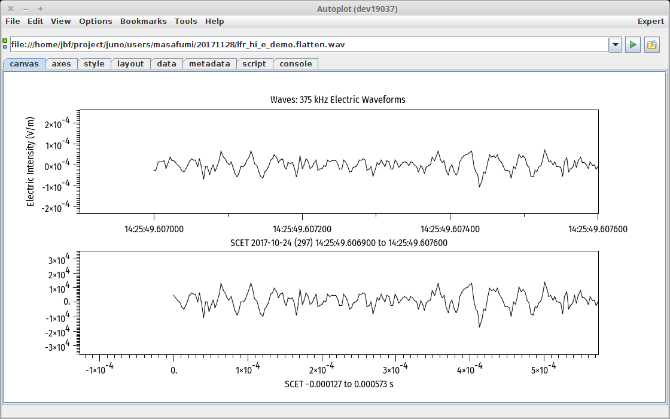
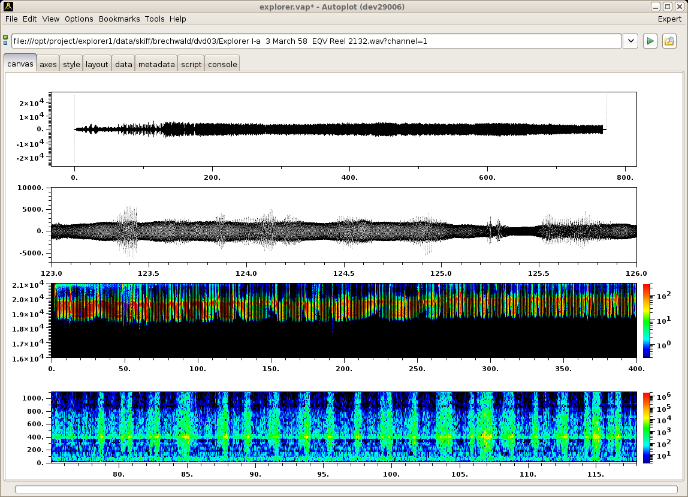
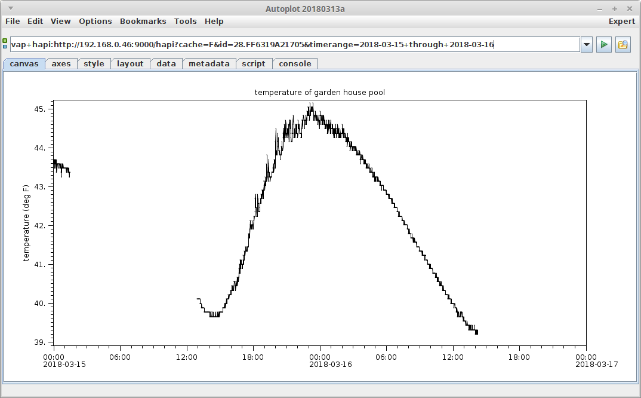
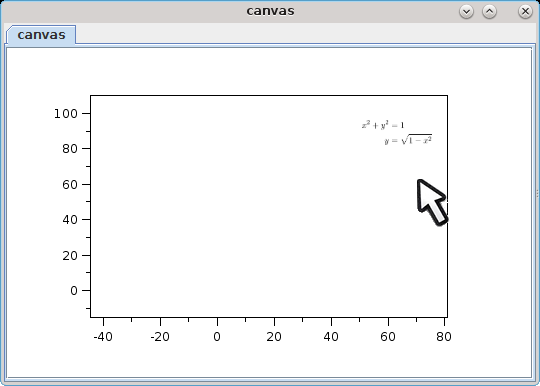
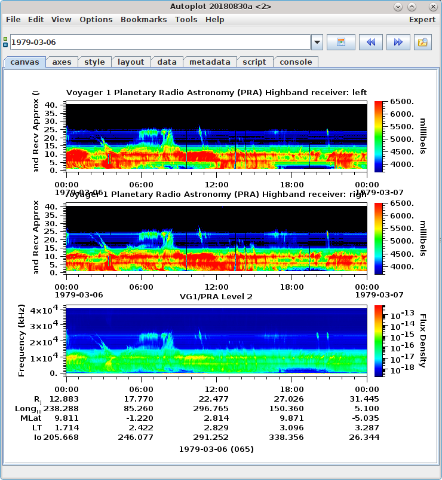
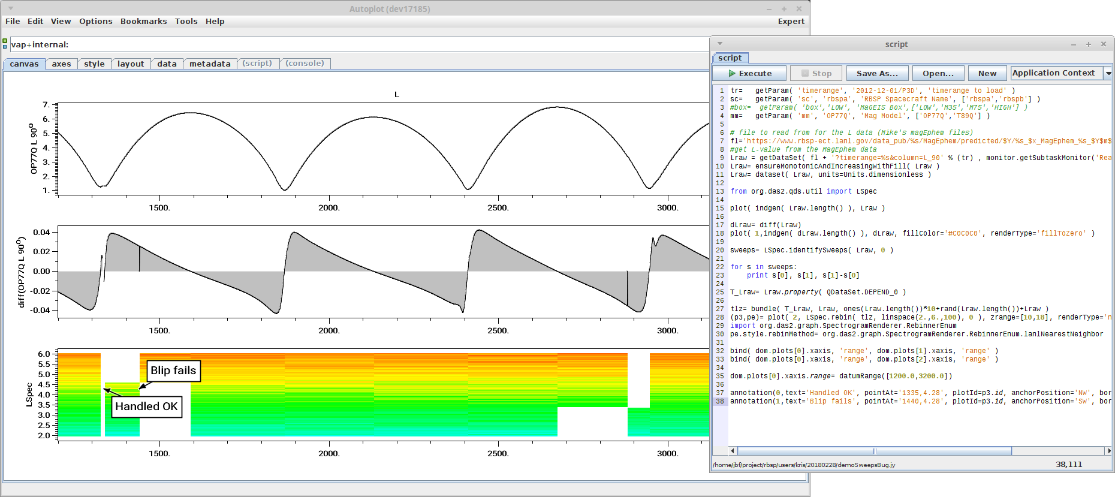
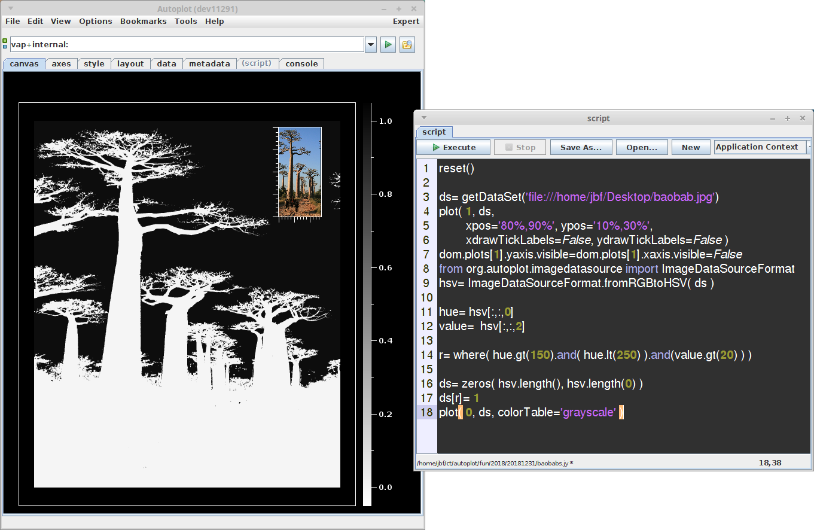
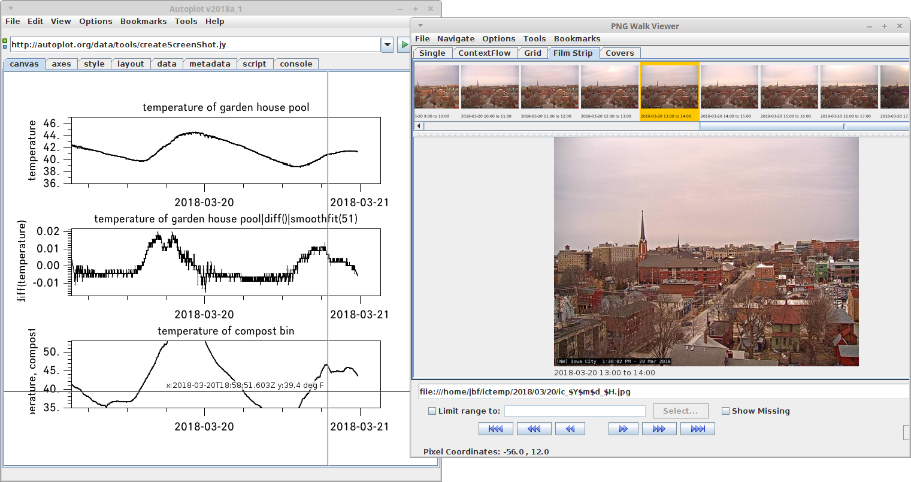
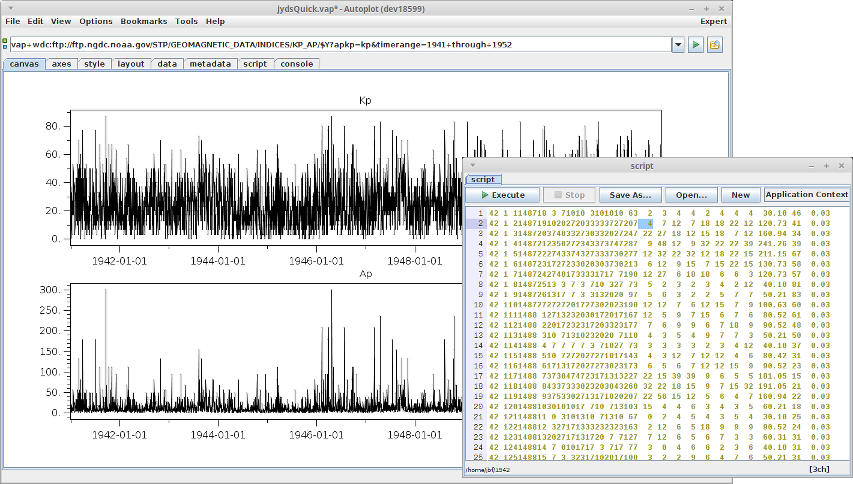
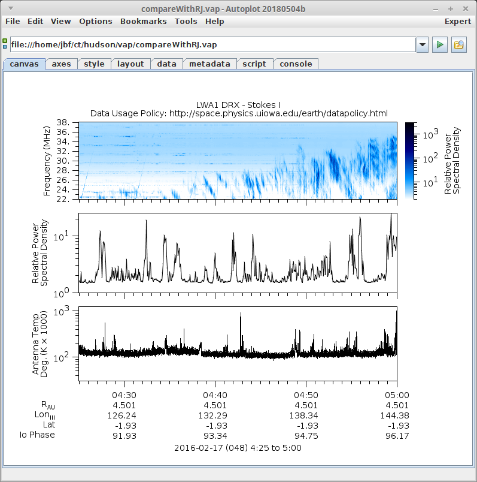
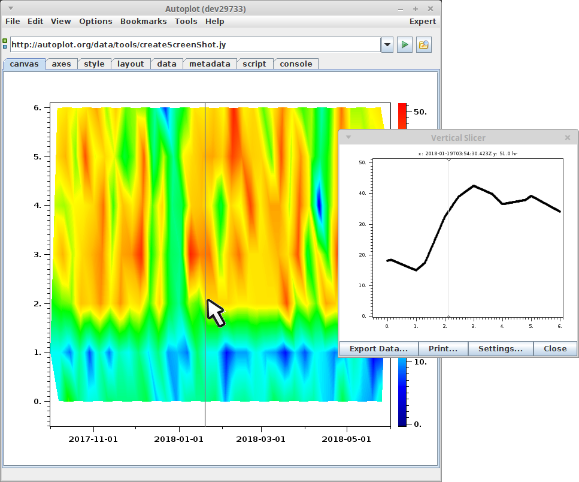
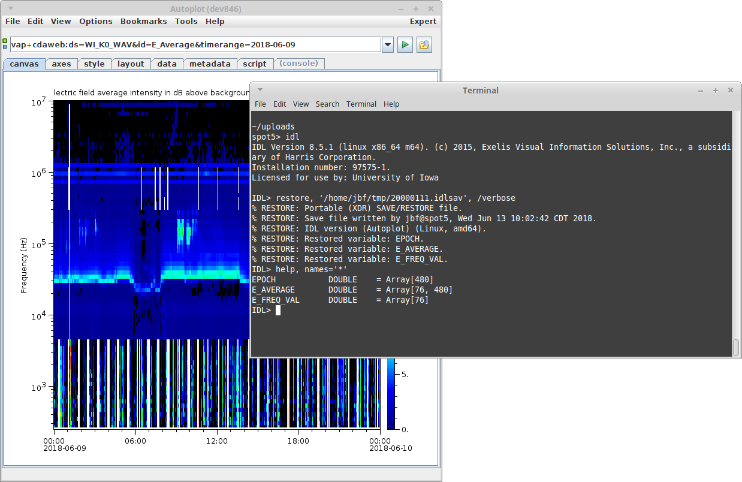
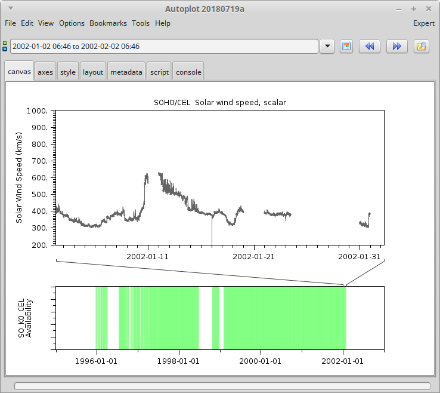
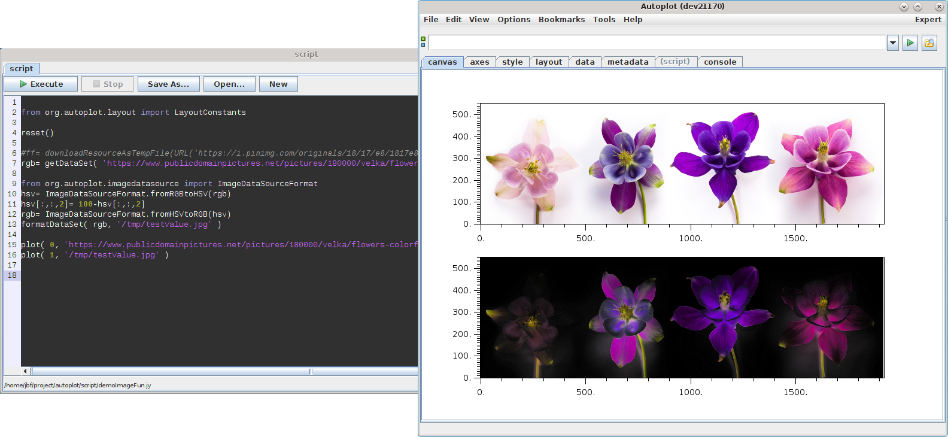
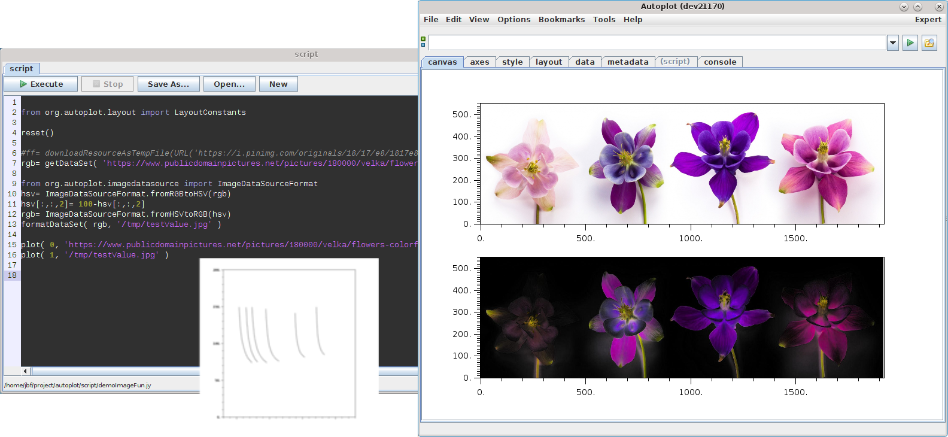
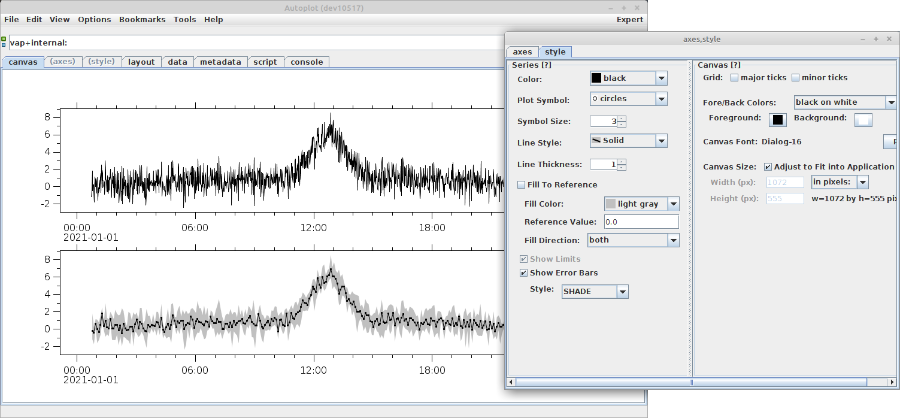
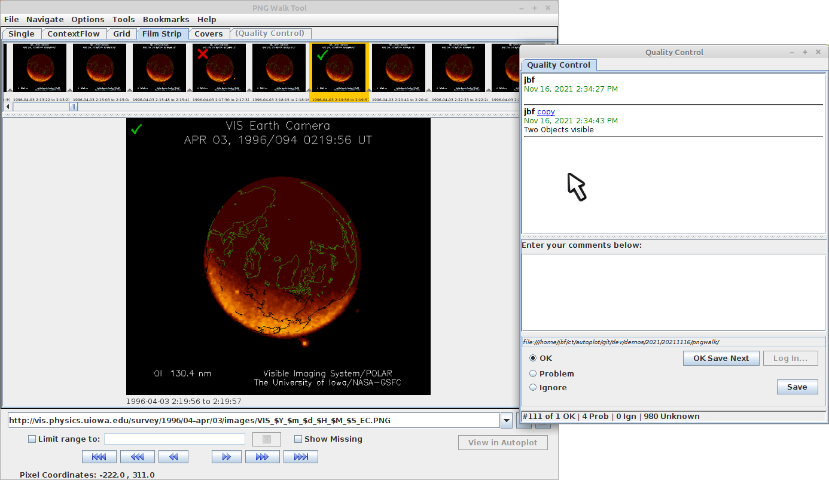
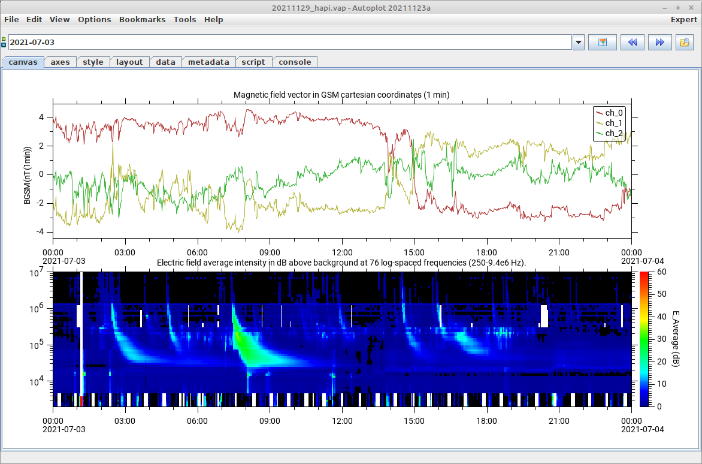
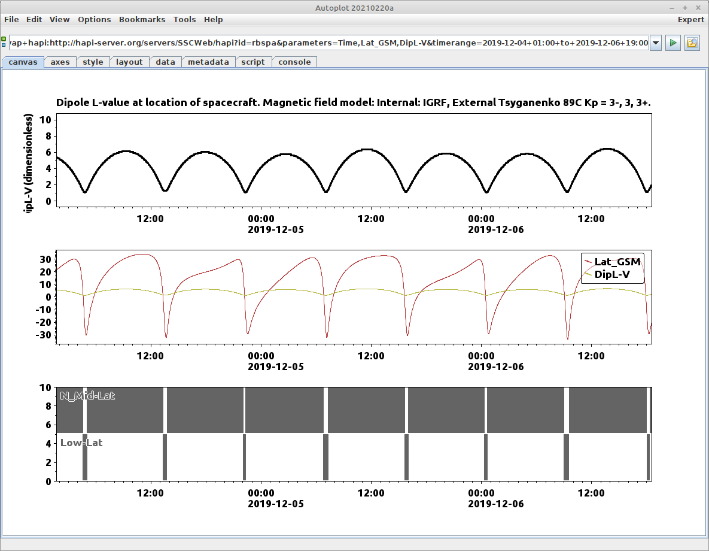
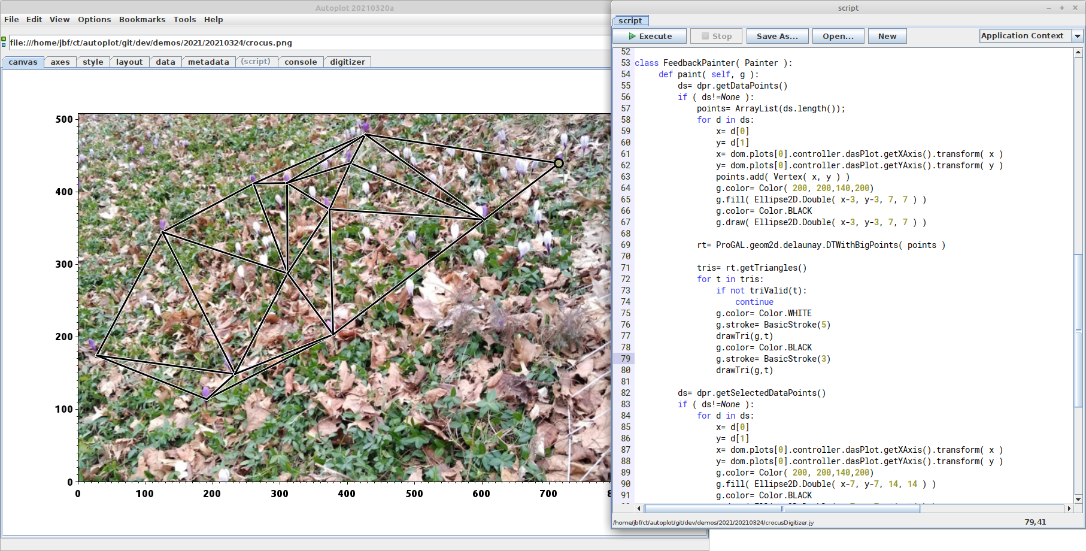
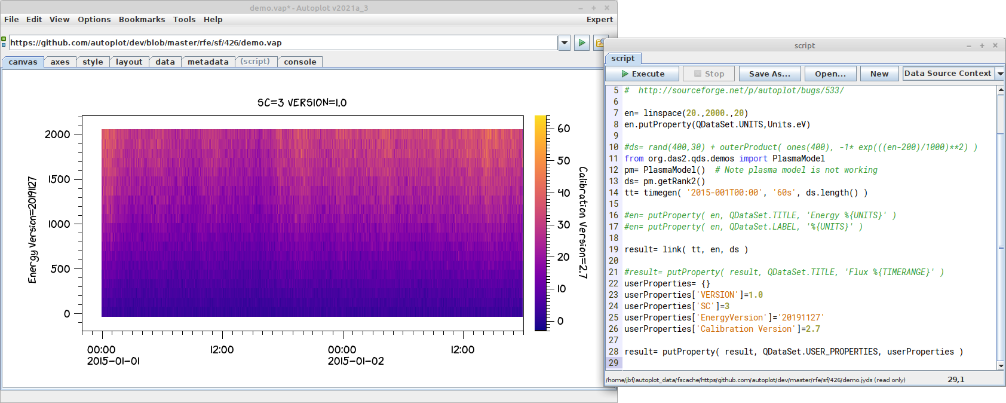
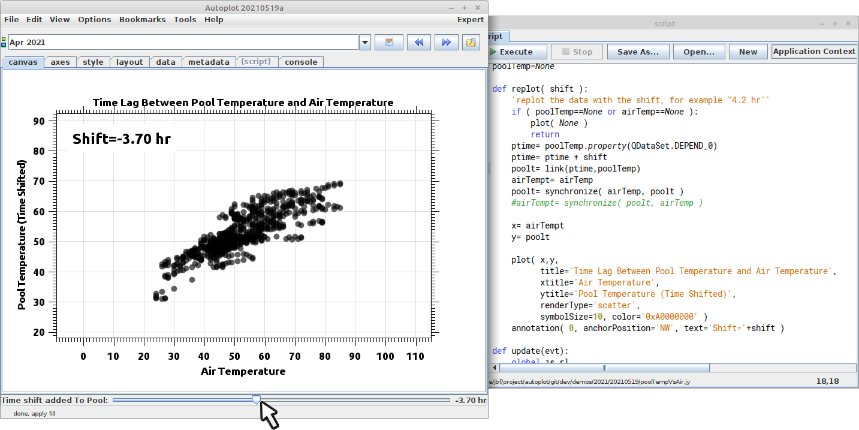
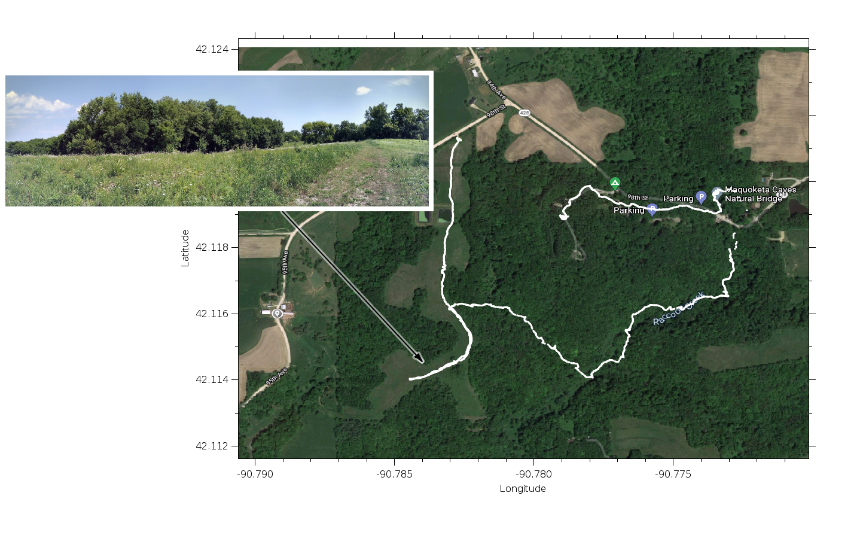
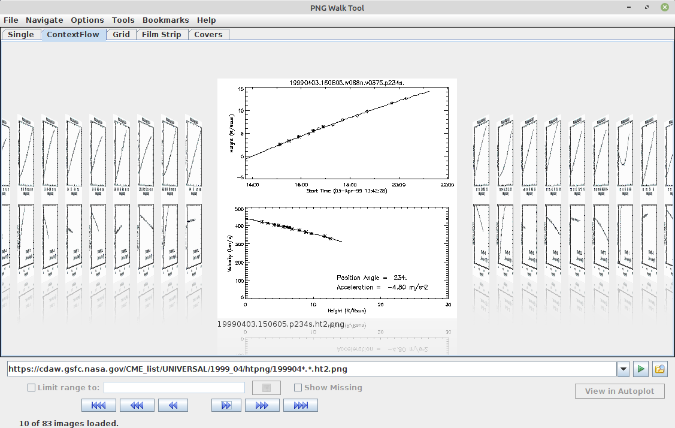
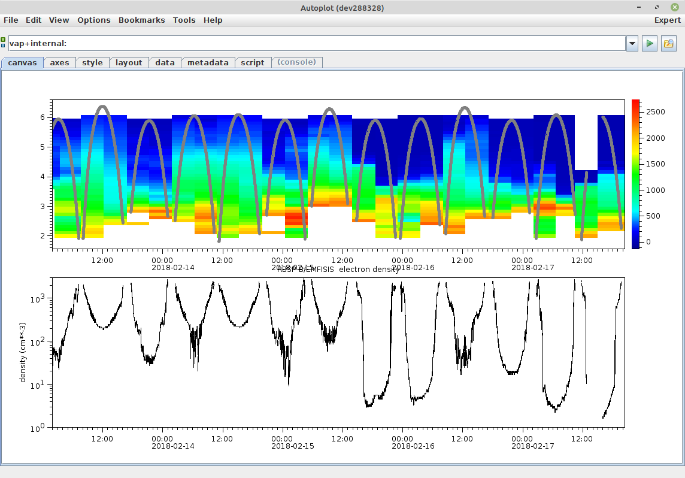
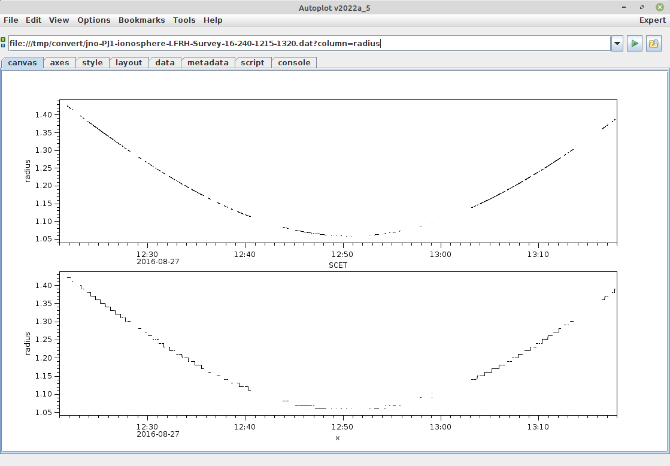
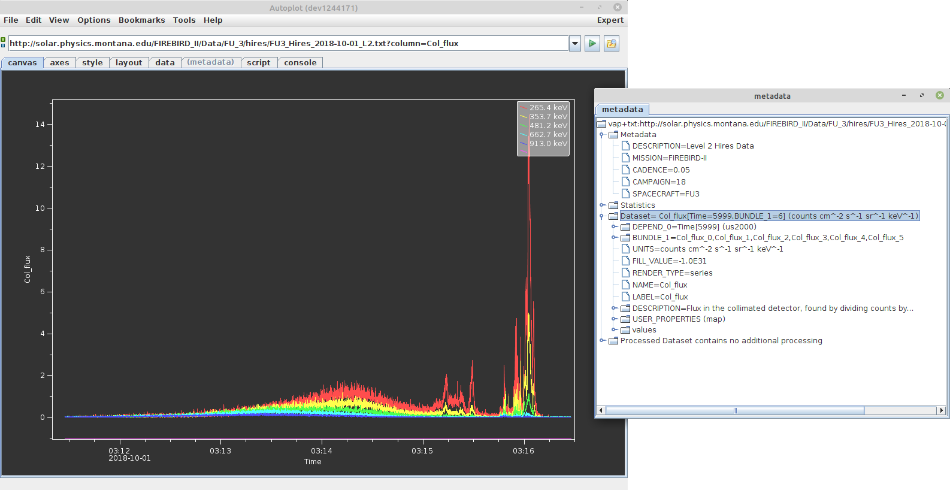
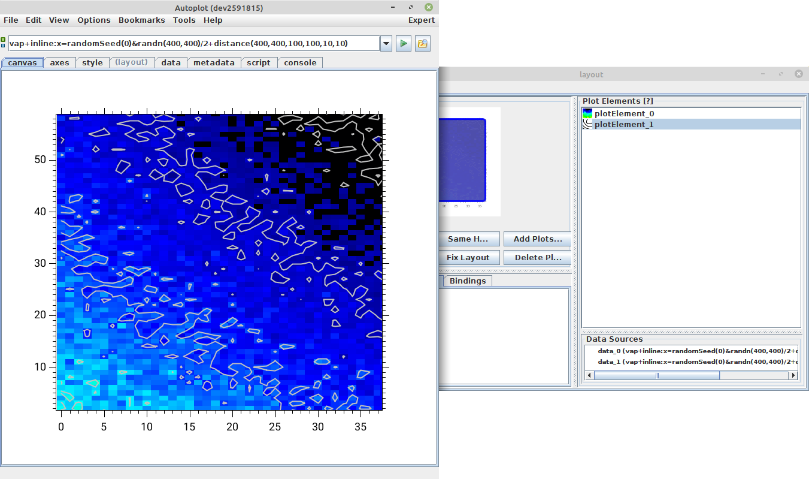
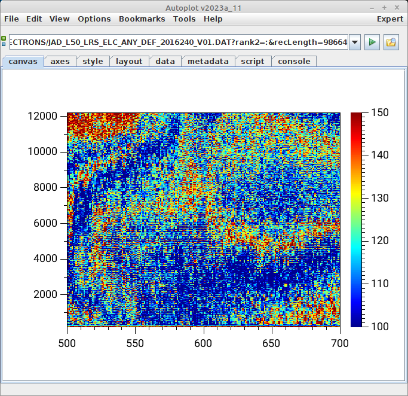
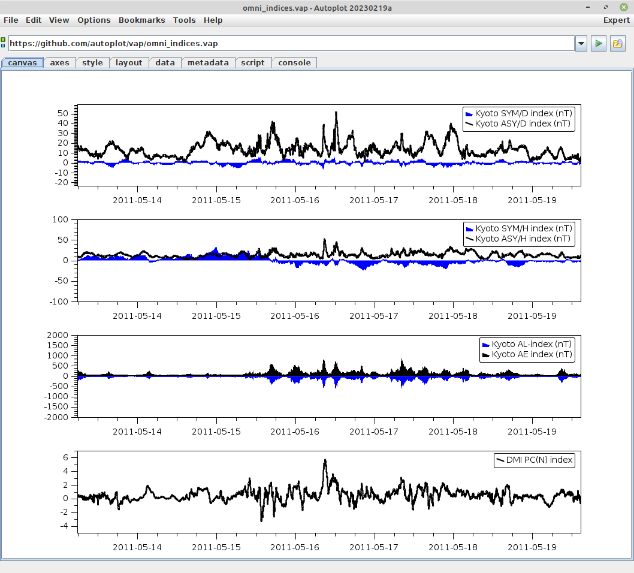
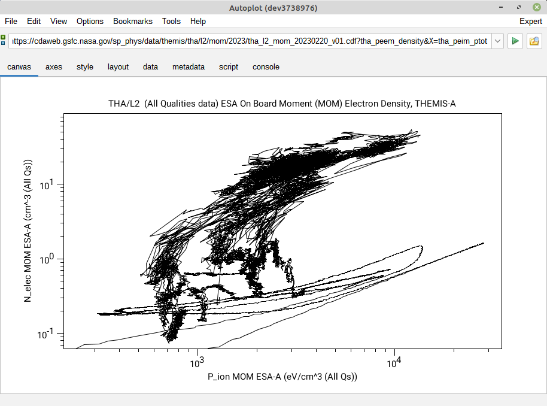
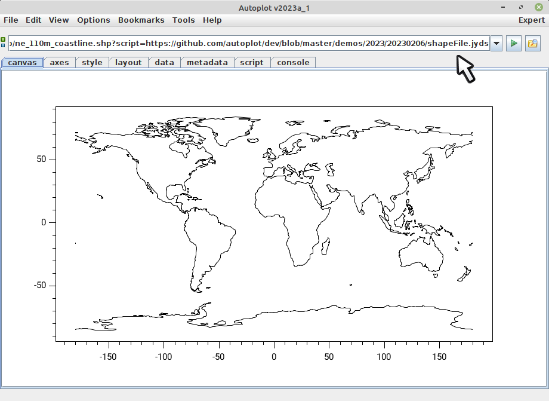
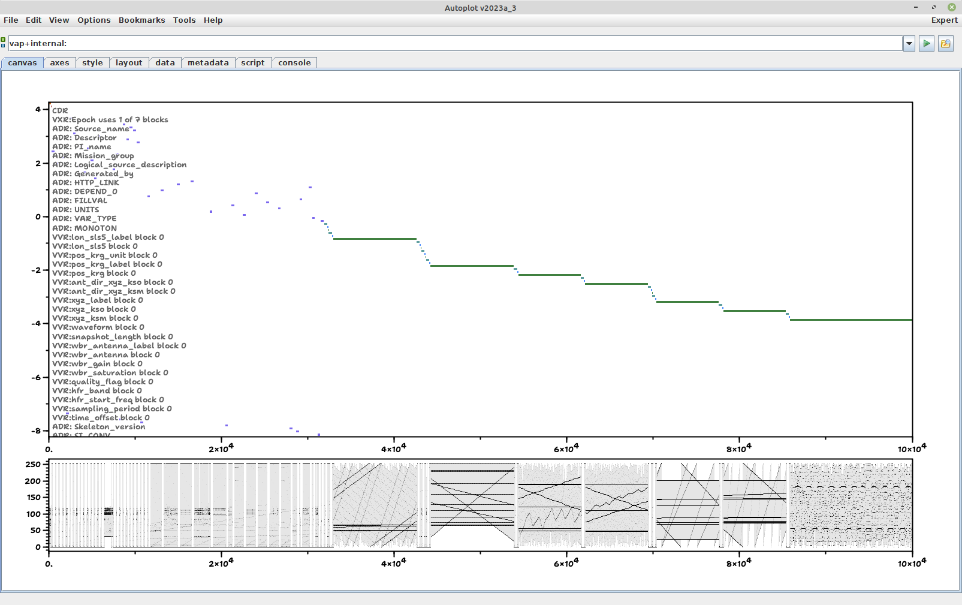
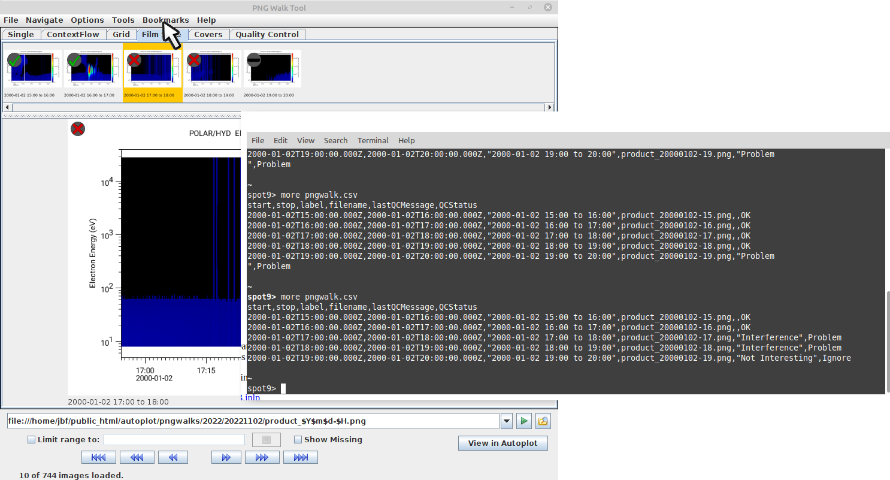
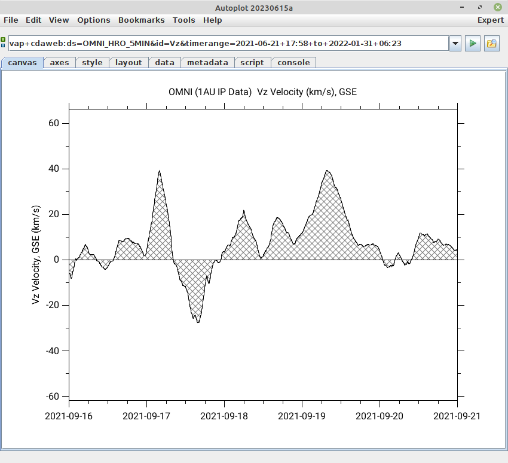
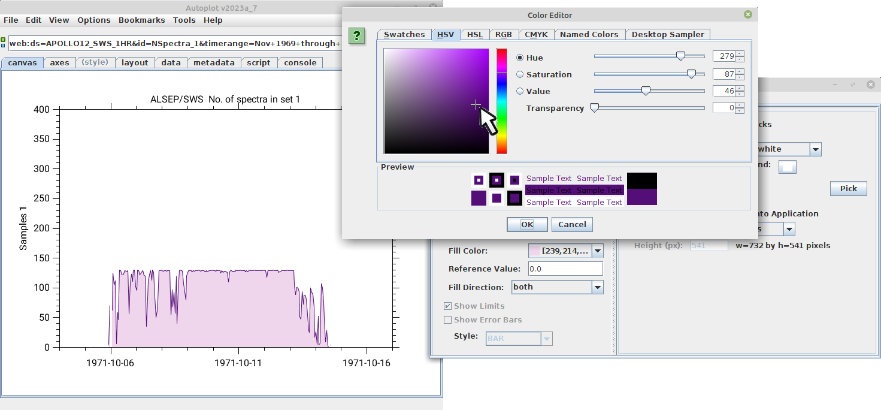
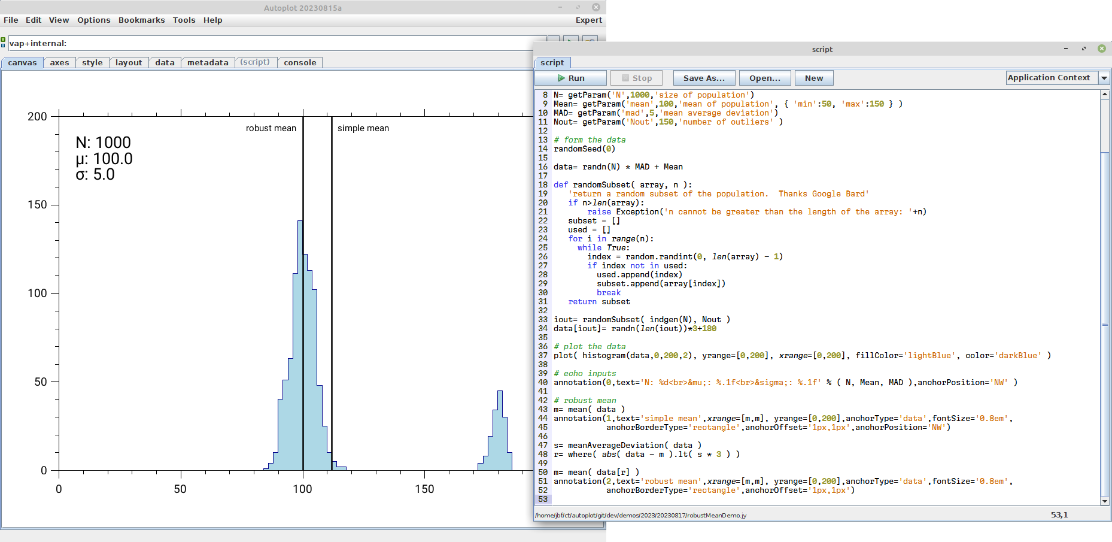
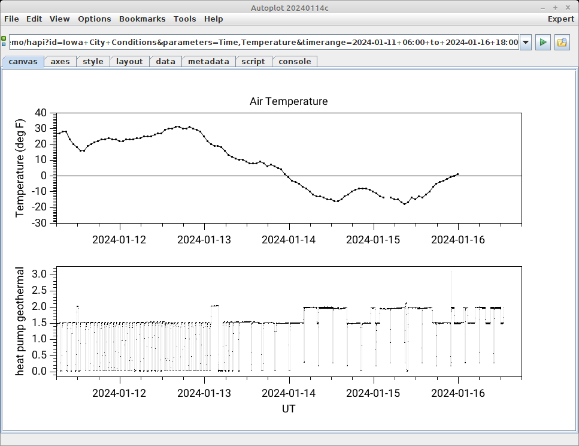
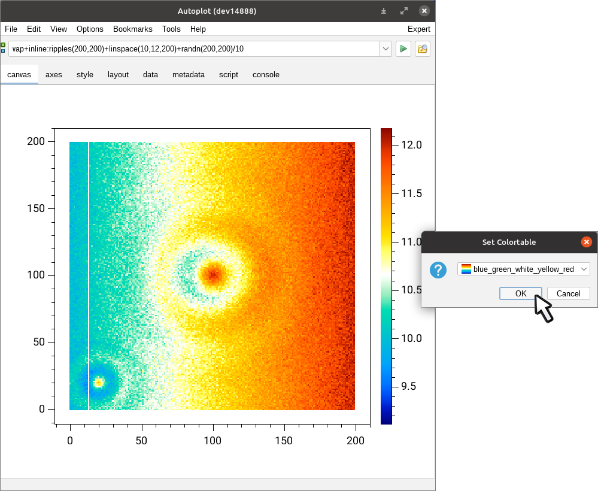
This collection of images has been collected from release screenshots over the years. Mouse over images to see captions, and click on any to see a particular release screenshot.

Click an image to expand/contract
v2017a_1
Quick study of automated testing read times shows where the time it takes to read a file is bimodal.
v2017a_2
The Events List tool is used to select time ranges from a list of time intervals. Here is an example ...
v2017a_3
Color GUI allows selection from 140 named colors.
v2017a_4
Happy Halloween!
v2017a_5
The DataPointRecorder now allows fill to be manually entered, breaking the connecting line.
v2017a_6
Old bug where first ten records of a wav file were dropped is corrected.
v2017a_7
Spectrograms made from waveforms of Explorer 1 telemetry. This week is the 60th anniversary of its launch.
v2018a_1
1-Wire sensor and HAPI server hosted on Raspberry Pi monitor pool temperature.
v2018a_10
Annotations can contain scaled images, so LaTeX rendered on remote sites can be rendered at 300 dpi.
v2018a_11
Voyager PRA data from a Das2Server.
v2018a_12
Autoplot is used to diagnose a problem when identifying continuous L-shell sweeps.
v2018a_14
Silhouette of Baobob trees made with where on image hue data. The ...
v2018a_2
Temperature trend of compost bin and garden pool both seem to change at the same time. Clouds? Happy Spring!
v2018a_3
vap+wdc prefix parses the World Data Center KP/AP files without mention of the .jyds script which reads the data files. The script editor is used to show one of the files.
v2018a_4
Autoplot can read .sps and .spd files from NASA's Radio JOVE project.
v2018a_5
Corrections to tri-scat rebin mode to support slicing.
v2018a_6
Export to IDLSave now supports rank 2 (spectral) data.
v2018a_7
SOHO Solar Wind Speed, above plot showing data availability at CDAWeb.
v2018a_8
Having fun with RGB to HSV conversions. Here's ...
v2018a_9
Having fun with RGB to HSV conversions. Here's ...
v2019a_1
Script uses decorator to draw graph paper showing data coordinates for debugging ...
v2019a_10
New Das2Stream reader works for peaks-n-averages again.
v2019a_11
PNG Walk Tool used to study final RBSP orbits.
v2019a_12
Cluster/PEACE data shown with Sci-Py Plasma colorbar. The default colorbar to use can now be set in [menubar]->Edit->Options.
v2019a_2
"putProperty" filter used to make negative parts of spectrogram transparent.
v2019a_3
Selecting a box on the right highlites the points in the time series on the left. Here's ...
v2019a_4
PngWalk Tool Digitizer correctly handles plots and images without X axis.
v2019a_5
This artifact from automated testing, tests one of histogram codes.
v2019a_6
Paste plot from clipboard is corrected. Here a ...
v2019a_7
CDF Editor shows documentation for CDF variables, and here we load data where the quality is marked as good.
v2019a_8
Slices filter used to look at Cluster/CIS data from a CEF file.
v2019a_9
New CDF editor droplist allows searching metadata for strings like "Omnidirectional." Happy Autumn!
v2020a_1
A rank 2 elevation map is interpolated with digital renderer to show depth. The ...
v2020a_10
Feedback is improved when malformed CDF files are read.
v2020a_11
Several datasets can be loaded at once from a CDF file.
v2020a_12
Access from FTP site works again, where the username and password is only entered once. Images from https://www.wftpserver.com/.
v2020a_13
Power plant database read directly from Github with this ...
v2020a_14
Run Batch tool is used to run a script with different parameters.
v2020a_15
v2020a_2
Two PNGWalks are linked together, used to make sure new images are properly named. See the ...
v2020a_3
USGS DEM Reader shown with new interface. ...
v2020a_4
Feather Plot script is found quickly under ...
v2020a_5
BufferDataSet's append method had new code containing a bug missed by automated testing. Hope everyone is healthy!
v2020a_6
IDLSave file which sat for twenty years untouched can now be read into Autoplot. The IDLSave file was from an IDL digitizing code that was used to identify a reference point in images. The ...
v2020a_7
GitHub Filesystem bug corrected and multiple threads can read from New York Times CSV file hosted on GitHub.
v2020a_8
Second GitHub Filesystem bug corrected and multiple threads can read from New York Times CSV file hosted on GitHub.
v2020a_9
Controls for X=, Y=, and Z= keywords added to the ASCII Editor Panel.
v2021a_1
New mouse action allows averaging data over a interval in Y.
v2021a_10
Shade Error Bar type shows the error envelope as a shaded region.
v2021a_11
Read-only PNGWalks can now be annotated with the PNGWalk Quality Control tool.
v2021a_12
Example plot from HAPI servers. Here's the ...
v2021a_2
SSCWeb ...
v2021a_3
Delaunay triangulation of purple flowers in garden. Here's ...
v2021a_4
USER_PROPERTIES are used to convey custom metadata from data loading to plot, as demonstrated in ...
v2021a_5
...
v2021a_6
Prairie at Maquoketa Caves State Park. Happy Summer!
v2021a_7
createDataPointRecorder() command creates an table component for digitizing which can export data to CDF and other formats. See ...
v2021a_8
Export data from a slicer correctly formats to time resolution specified, and script "createDataPointRecorder" command allows the data to be exported into many formats.
v2021a_9
Autoplot script uses FileSystems to study which files have been loaded into CDAWeb.
v2022a_10
The "bounds" renderer works again with a time series of bounding intervals, and hash fill has been added. ...
v2022a_11
New boundsDataset command used with in-line source to add box, and an annotation is used to add a label.
v2022a_12
Moon position in GSE from AMDA HAPI server. (vap+hapi:http://amda.irap.omp.eu/service/hapi?id=moon-earth-all&parameters=Time,xyz_moon_gsm and ...
v2022a_2
Autoplot's File System API supports .tgz files now, which will be downloaded and listed automatically. Happy Twosday!
v2022a_3
Improvements to .pngwalk file make it easier to annotate remote pngwalks. Here an old pngwalk at NASA CDAWeb is annotated.
v2022a_4
Pngwalk Tool used to flip through IDL output at CDAWeb.
v2022a_5
Revisiting the Cookbook's ...
v2022a_6
Script used to reload spacecraft position which had been represented in ASCII file with insufficient resolution.
v2022a_7
The code for handling JSON-Headed ASCII (Rich ASCII) is updated to handle slight changes in the spec.
v2022a_8
Support for datasets with BINS for DEPEND_0 is improved, ...
v2022a_9
Length mouse action can be divided into regular intervals by pressing 1 through 9, and frequency shown by editing the property under the controller.
v2023a_1
The CSV reader is used to easily read the output of commercial temperature sensors monitoring the pool water temperature and ground temperature outside of the pool.
v2023a_10
Barrel mission SSPC data is used to demonstrate vertical slice.

v2023a_11
Contour plot overplotted on a spectrogram of fake data.

v2023a_12
Interesting screen encountered while parsing PDS3 binary files from Juno/JADE from PDS-PPI. Wouldn't it be nice to have a PDS3 parser? ...
v2023a_2
Old ...
v2023a_3
CDF Editor Panel allows one parameter to be plotted against another.
v2023a_4
Shape files can be read in using the script ...
v2023a_5
Binary data source used to look at the bytes of a CDF file, and ...
v2023a_6
PNG Walk Tool now has Tools→"Write to CSV" action, which writes out PNG walk times and quality control information to one file.
v2023a_7
FillTexture property can be used with series plot element type now. Set "fillTexture=crosshash" for the renderControl property of the plot element or load ...
v2023a_8
Color picker used to get just the right purple for old Apollo12 data from CDAWeb.
v2023a_9
New Jython demo shows a ...
v2024a_1
A quick glance with Autoplot shows geothermal heat is keeping up with the cold.

v2024a_2
Right-click on the color bar to change which color table is used.

v2024a_3
2017 eclipse cloud cover from read from citizen science ...
v2024a_4
Old dog foot prints database found, and demonstrates that spaces within .zip files are handled properly.

v2024a_5
Experiments with an upcoming new version of the CDAWeb HAPI server.