das2py: The python das2 client package
This module builds upon the functionality provided by the C-library, libdas2, to bring to das2 client capabilities to C-python programs. Functionality provided in this package:
- Locates data sources across institutions using the federated das2 data catalog.
- Converts data sub-set queries into back-end server protocol messages.
- Efficently reads data streams to directly into numpy arrays.
- Assists with generating matplotlib plots.
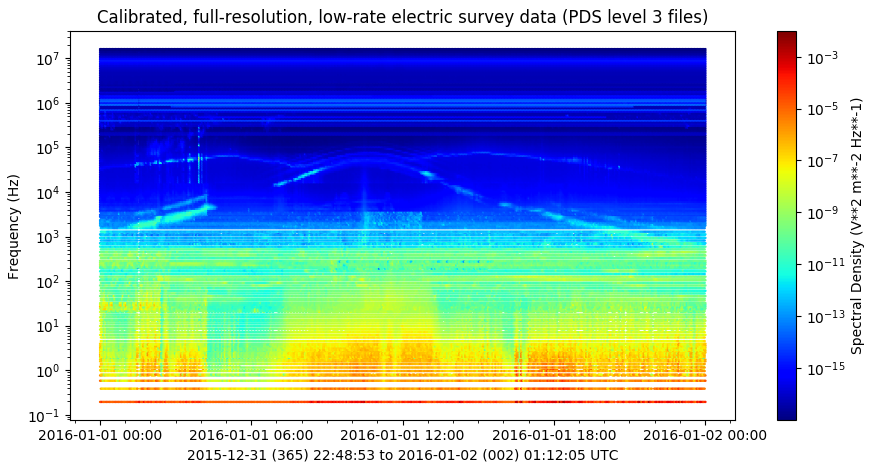
Das2py does not provide any builtin plotting capabilities. Instead that task is left to the quite capable matplotlib package, or any other plotting software that can read numpy arrays. The plot below was generated from Cassini RPWS Multimode Electric Survey spectra using das2py to gather the data and matplotlib to render the image.

The complete application code for generating the plot above can be found in Example 03.
Short Walkthrough
The point of this section is to provide a mental picture of what the software is upto when various functions are called. As a frame of reference here’s an example das2 server system configuration.
Simplified das2 catalog and data services
The das2 data system is organized using a distributed catalog of static JSON (JavaScript Object Notation) documents, denoted as yellow pages above. The cononical root of this hierarchy is the single file at https://das2.org/catalog/index.json, or one of it’s mirrors. Higher level documents contain URLs that point to lower level documents, thus providing a catalog hierarchy. Since absolute URLs are required, catalog nodes can reside anywhere on the Web. Static JSON files were selected as the information infastructure of choice as common institutional IT security policies often make it difficult to open up software services, such as relational database systems, to the outside world. Unlike a software oriented solution, static files are usually acceptable and easily recovered after a server malfunction.
The lowest level nodes in the catalog define data source interfaces. In the diagram above the data source nodes have been left out as these are used by the das2py Collection object behind the scenes, though it is possible to use them directly. Typically the actual data values are provided as das2 streams served from a das2 server, though work is underway to support more stream formats as well as static CDF files.
Data Source Definitions
Most das2py source code examples start by providing a dota collection ID to the das2.get_source() function. This defines the source inside a local python object which can then be queried for data. In the code snippet below the data source collection for the Electric field Survey data from the Plasma Wave Instrument that was onboard the Galileo spacecraft is aquired:
import das2
meta_src = das2.get_source('site:/uiowa/galileo/pws/survey_electic')
When get_source() is called das2py will access the global catalog and walk it’s nodes until finding the node at the virtual path: tag:das2.org,2012:site:/uiowa/galileo/pws/survey_electic as illustrated below.
Walking the catalog tree to retrieve a data source collection node
Navigation of the federated catalog is handled by a single call. If a branch of the catalog happens to be off line, das2py will automatically back up and try an alternate branch. This behavior is true all we way up to the root node, which is duplicated off site for reliability.
Once a data collection definition has been aquired it can be queried for as subset of the data in a specified coordinate range at a desired resolution. If you just want example data an don’t care which data source provides it or how the data are sub-set in coordinate space the single call:
dataset_list = meta_src.get()
will get the job done. The output of this call is a python list of das2 dataset objects.
Installation
Todo
Caveat
All das2 stream values denoting a time interval (ex: seconds, minutes, years, etc) are stored as NumPy timedelta64[‘ns’] objects. Thus the largest time difference that can be understood by das2py is about 292 years. Any values outside this range are converted to fill. This limitation can be removed in the future if needed by auto selecting NumPy time units based on the data range and precision.