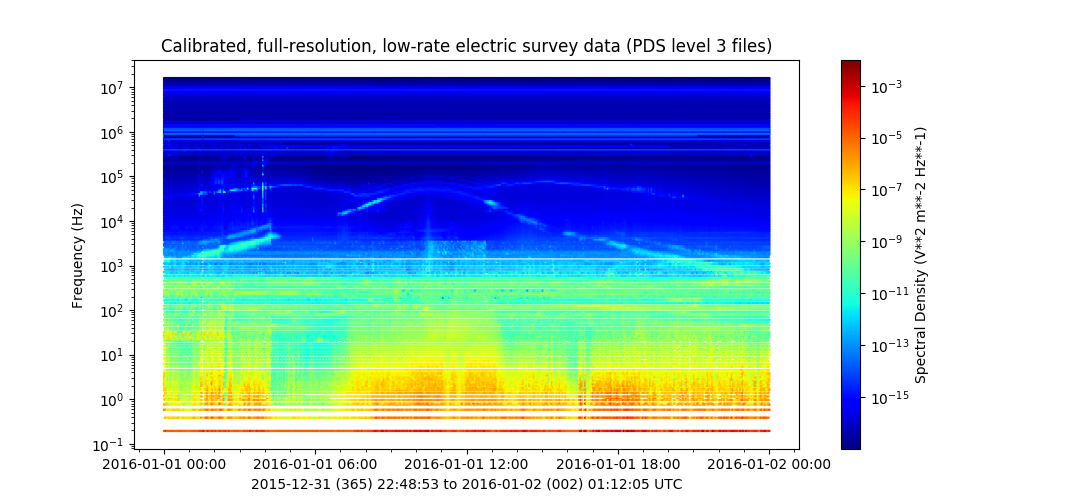
Ex 03: Multimode Spectra
Plotting Multimode Spectra using hexbin

1 2 3 4 5 6 7 8 9 10 11 12 13 14 15 16 17 18 19 20 21 22 23 24 25 26 27 28 29 30 31 32 33 34 35 36 37 38 39 40 41 42 43 44 45 46 47 48 49 50 51 52 53 54 55 56 57 58 59 60 61 62 63 64 65 66 67 68 69 70 71 72 73 74 75 | # das2 module example 3:
# Plotting Cassini RPWS multi-mode spectra using hexbin algorithm
import numpy
import das2
import sys
import matplotlib.pyplot as pyplot
import matplotlib.colors as colors
import matplotlib.ticker as ticker
# The Cassini RPWS Survey data source is one of the most complicated das2 data
# sources at U. Iowa. Data consist of multiple frequency sets from multiple
# recivers all attempting to cover the maximum parameter space within a limited
# telemetry alotment and on-board computing power. This example collapses
# all the provided datasets to a single scatter set for plotting
sId = "site:/uiowa/cassini/rpws/survey/das2"
print("Getting data source definition for %s"%sId)
src = das2.get_source(sId)
print("Reading default example Cassini RPWS E-Survey data...")
lDs = src.example()
# Combining multiple spectra into one overall array set
print("Combining arrays...")
lX = []
lY = []
lZ = []
for ds in lDs:
# As of numpy version 1.15, the numpy histogram routines won't work
# with datetime64, and timedelta64 data types. To Working around a
# this problem time data are cast to the int64 type
lX.append(ds.coords['time']['center'].array.flatten().astype("int64"))
lY.append(ds.coords['frequency']['center'].array.flatten() )
lZ.append(ds.data['amplitude']['center'].array.flatten() )
aX = numpy.ma.concatenate(lX)
aY = numpy.ma.concatenate(lY)
aZ = numpy.ma.concatenate(lZ)
(fig, ax0) = pyplot.subplots()
print("Plotting..")
clrscale = colors.LogNorm(vmin=aZ.min(), vmax=aZ.max())
hb = ax0.hexbin(aX, aY, aZ, yscale='log', gridsize=(400, 200),
cmap='jet', norm=clrscale )
cbar = fig.colorbar(hb, ax=ax0)
# Since matplotlib can't bin datetime64 values, will have to do our
# own axis labeling. das2 plot help functions are useful here.
nMinor = 60
nMajor = 6*60
ax0.xaxis.set_minor_locator(ticker.MultipleLocator(nMinor*60*int(1e9)))
ax0.xaxis.set_major_locator(ticker.MultipleLocator(nMajor*60*int(1e9)))
fmtr = das2.MplTimeTicker(aX.min(), aX.max())
ax0.xaxis.set_major_formatter(ticker.FuncFormatter(fmtr.label))
# Plot labels
ax0.set_xlabel(das2.ph_ns1970_range( ax0.get_xlim() ))
sUnits = lDs[0]['frequency']['center'].units
ax0.set_ylabel("Frequency (%s)"%das2.mpl_text(sUnits))
sUnits = lDs[0]['amplitude']['center'].units
cbar.set_label("Spectral Density (%s)"%das2.mpl_text(sUnits))
# Stream didn't contain a title, use the one from the data source
ax0.set_title( src['title'] )
pyplot.show()
|